| Site | Component | Lat (N) | Long (W) | Azimuth | Distance |
|---|---|---|---|---|---|
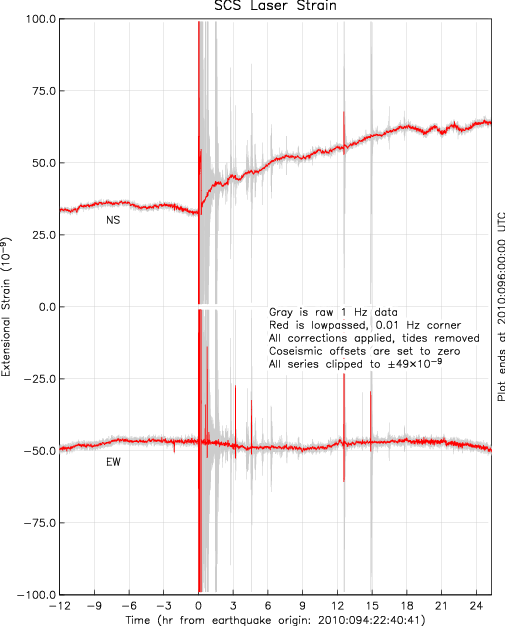
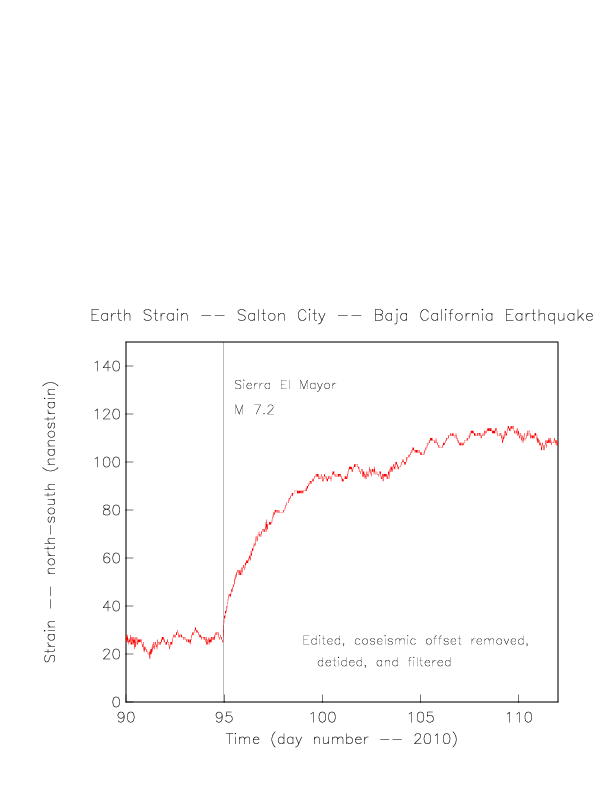
| SCS | NS | 33.247 | 115.944 | -0.3 | 73 |
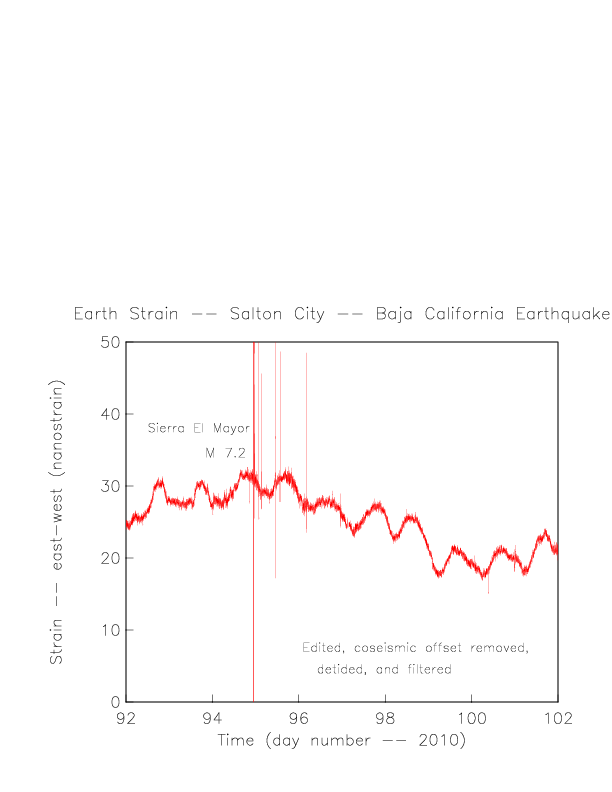
| SCS | EW | 33.247 | 115.944 | 89.7 | 73 |
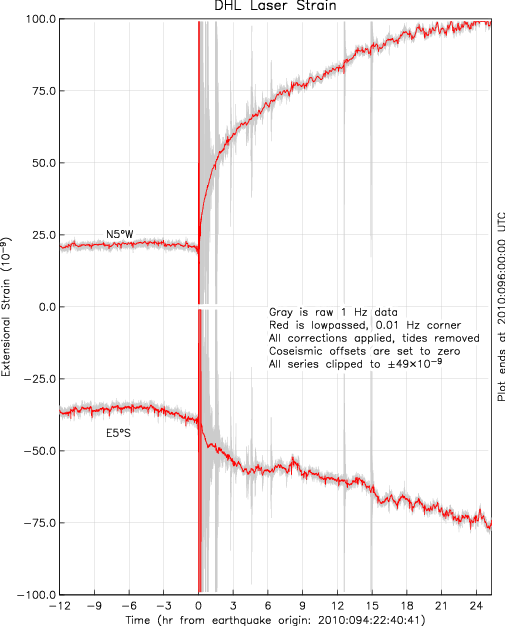
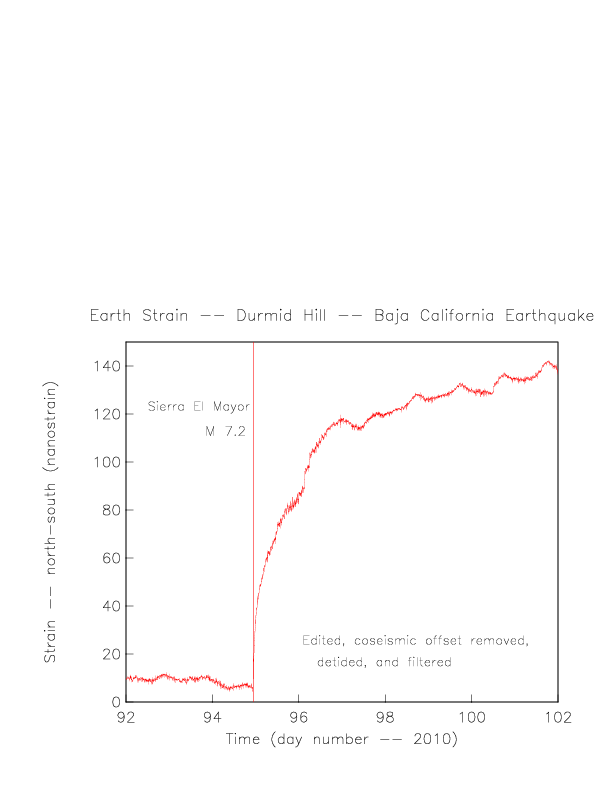
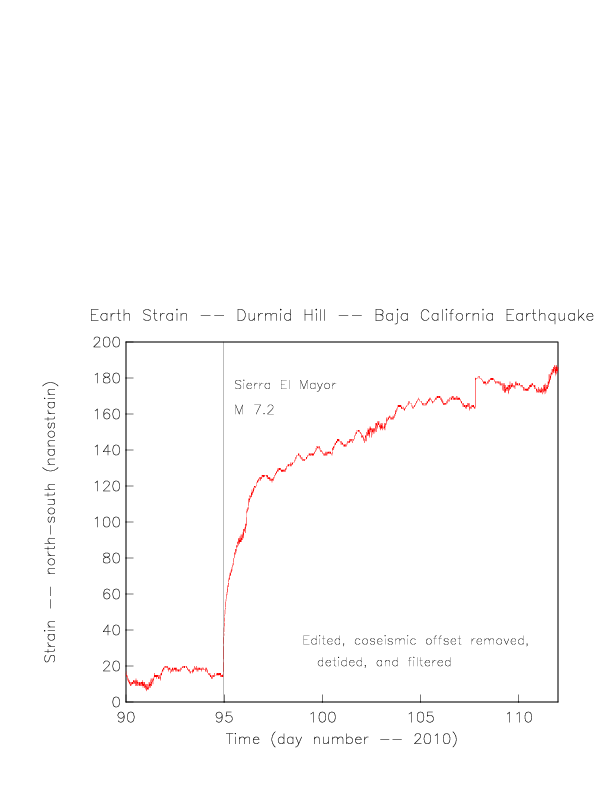
| DHL | NS | 33.392 | 115.788 | -4.3 | 87 |
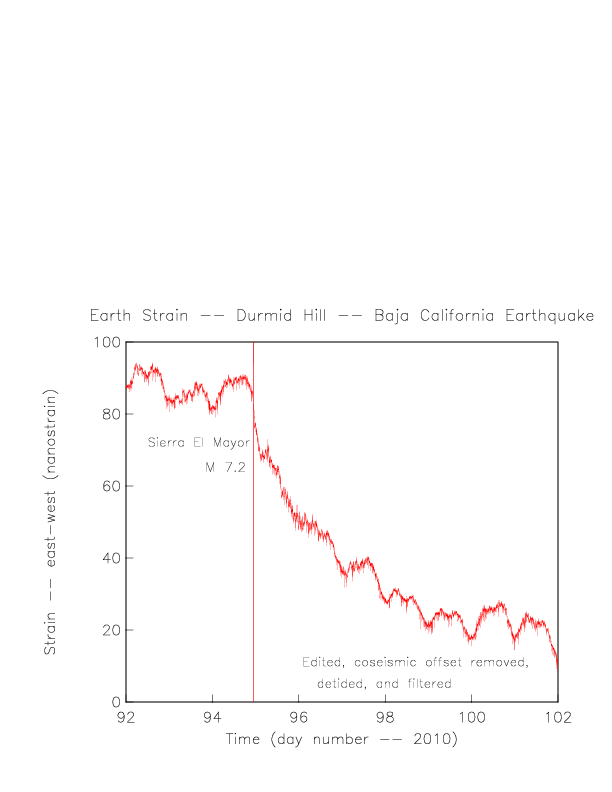
| DHL | EW | 33.392 | 115.788 | 85.6 | 87 |
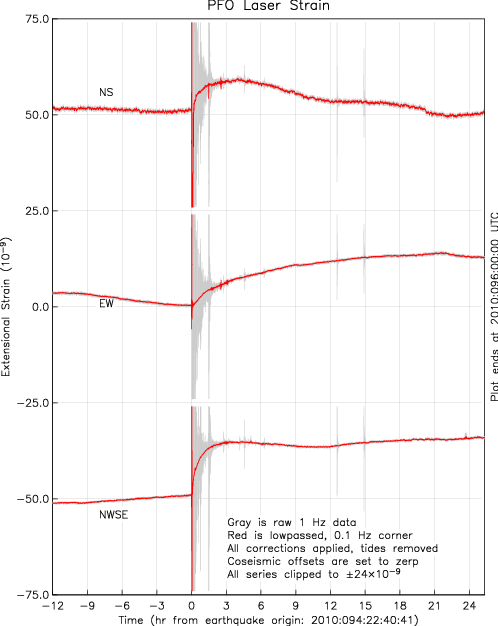
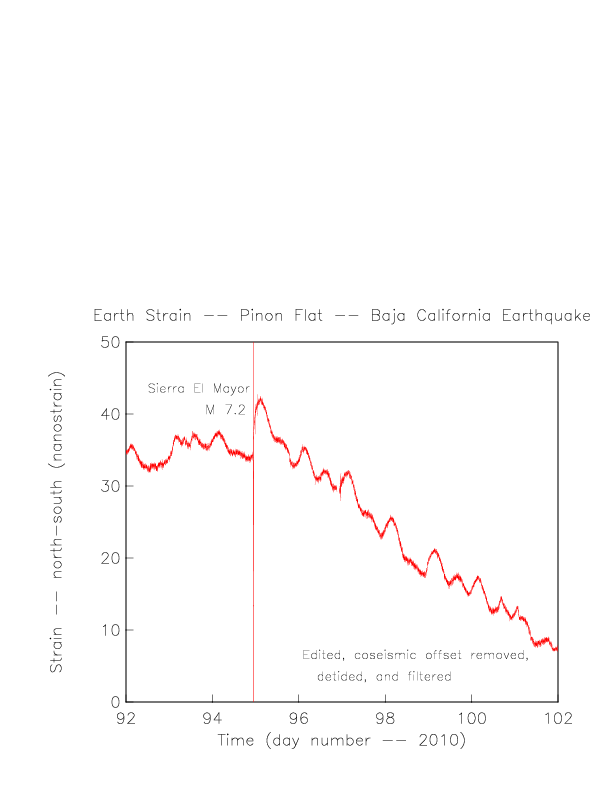
| PFO | NS | 33.609 | 116.455 | 0.3 | 129 |
| PFO | EW | 33.609 | 116.455 | 90.4 | 129 |
| PFO | NW | 33.609 | 116.455 | 135.3 | 129 |
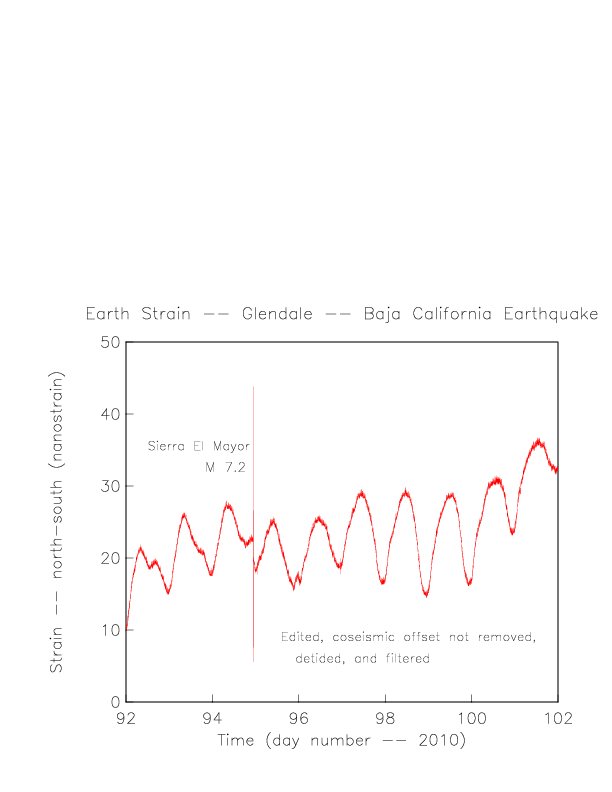
| GVS | NS | 34.176 | 118.221 | 14.7 | 288 |
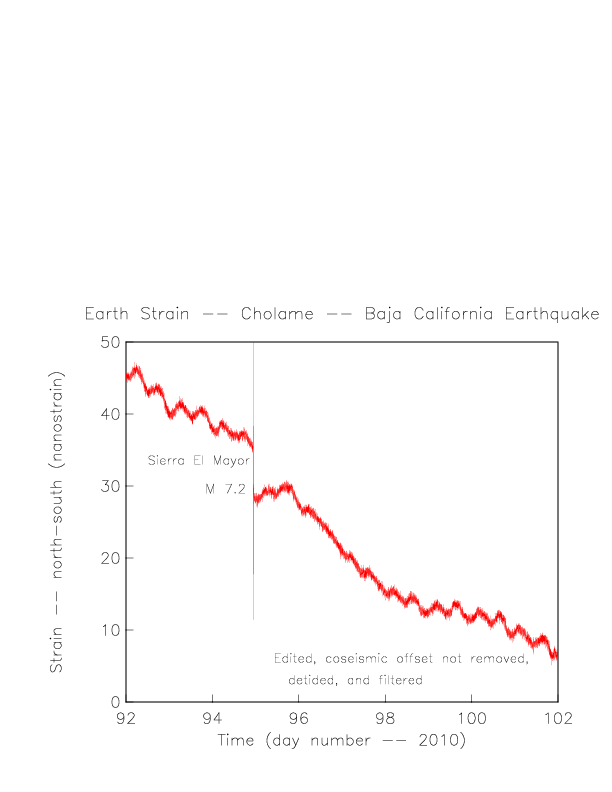
| CHL | NS | 35.692 | 120.216 | -0.4 | 535 |
| CHL | EW | 35.692 | 120.216 | 90.3 | 535 |
Distance is in km, measured from approximate North end of rupture.
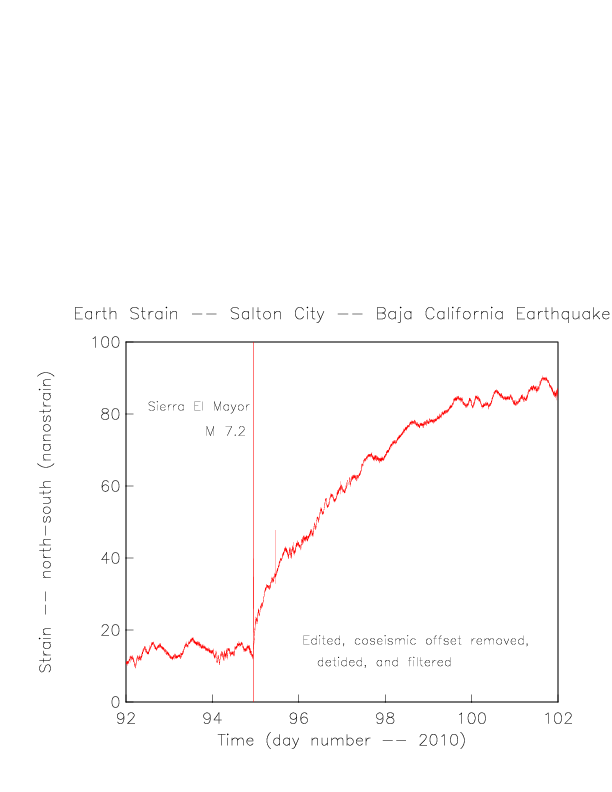
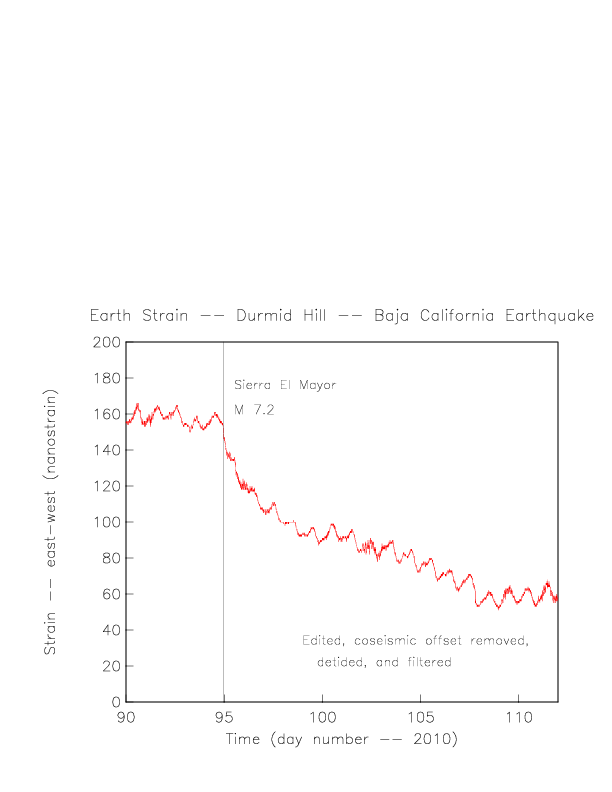
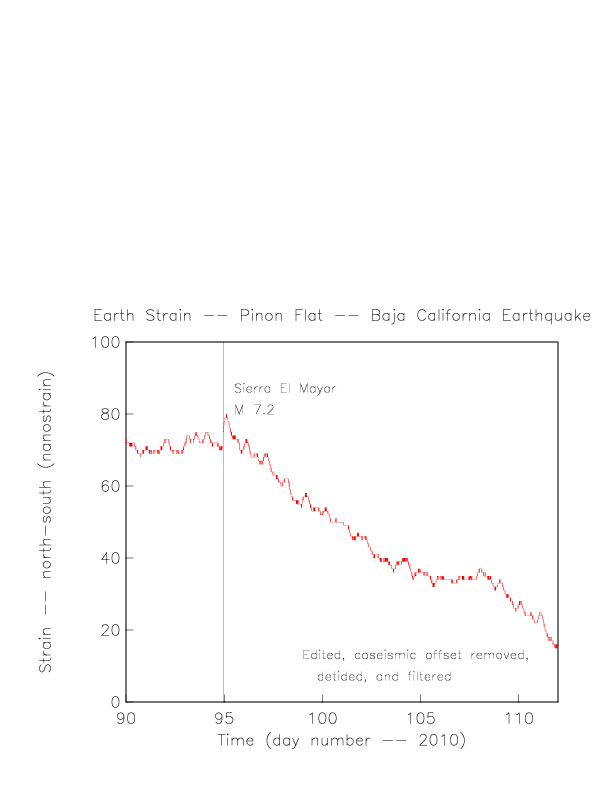
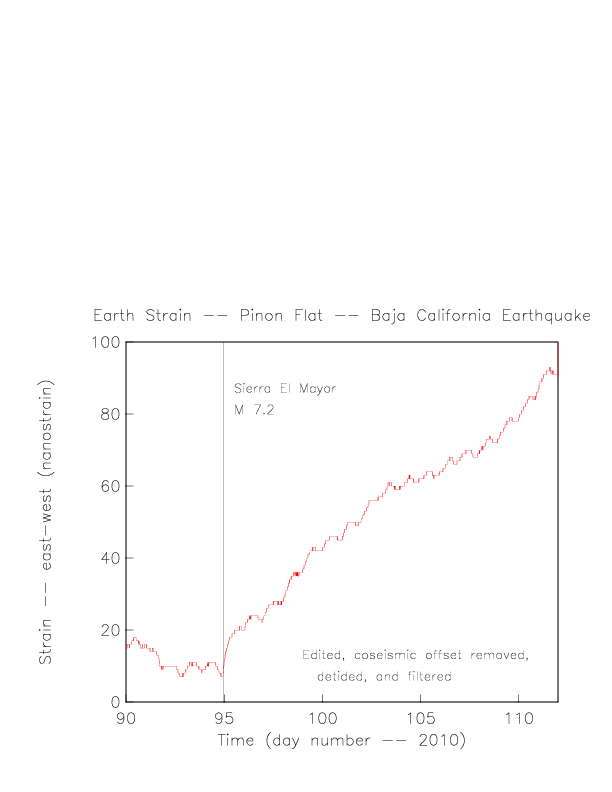
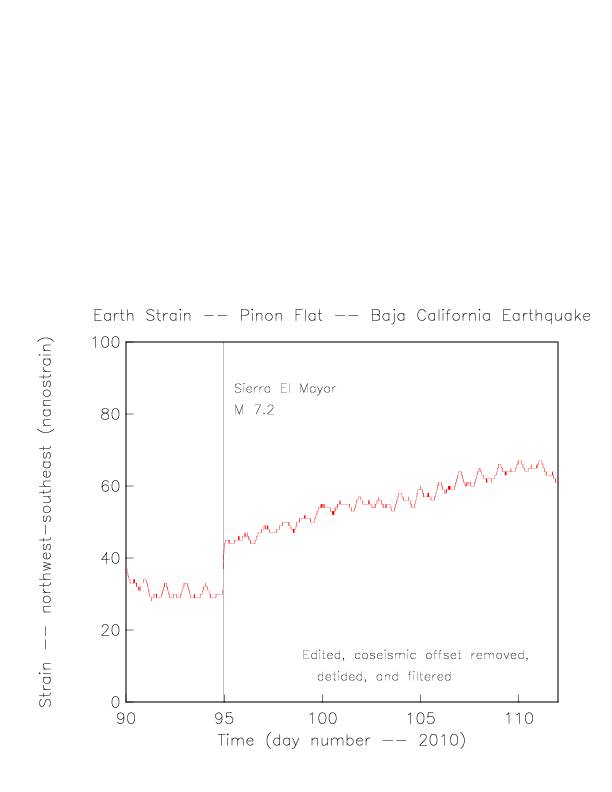
At most of the sites, we observed rapid strain changes that began at the same time as the arrival of the seismic waves. The dynamic strains from these waves were large enough that for 10-20 seconds the laser beam was moved too far to form an interference pattern. We thus do not have a record of the coseismic offset, and have set this to zero for each of these sites: SCS, DHL, and PFO. (This was not necessary for GVS and CHL recordings.)
| SCS | DHL | PFO |
|
|
|
|
| Click image to view or | Click image to view or | Click image to view or |
| click here for PDF file | click here for PDF file | click here for PDF file |
Over the first week, the strains at both of the closer sites (SCS and DHL) show a gradually-decaying postseismic strain; at DHL there are several small and relatively abrupt offsets whose relative amplitude on the two independent components argues that they were caused by creep events on the San Andreas fault. The two most distant sites (CHL and GVS) show little response in comparison, apart from day-long transient behavior. The records at Piñon Flat Observatory (PFO) show a change in the rate of strain, with signs that consistent with slip on the San Jacinto fault, which is similar to what was seen postseismically in response to the Anza, Caifornia, earthquake of 2005.
 SCS NS
(click image to view; click
here for PDF file)
SCS NS
(click image to view; click
here for PDF file)
 SCS EW
(click image to view; click
here for PDF file)
SCS EW
(click image to view; click
here for PDF file)
 DHL NS
(click image to view; click
here for PDF file)
DHL NS
(click image to view; click
here for PDF file)
 DHL EW
(click image to view; click
here for PDF file)
DHL EW
(click image to view; click
here for PDF file)
 PFO NS
(click image to view; click
here for PDF file)
PFO NS
(click image to view; click
here for PDF file)
 PFO EW
(click image to view; click
here for PDF file)
PFO EW
(click image to view; click
here for PDF file)
 PFO NW
(click image to view; click
here for PDF file)
PFO NW
(click image to view; click
here for PDF file)
 GVS NS
(click image to view; click
here for PDF file)
GVS NS
(click image to view; click
here for PDF file)
 CHL NS
(click image to view; click
here for PDF file)
CHL NS
(click image to view; click
here for PDF file)
 CHL EW
(click image to view; click
here for PDF file)
CHL EW
(click image to view; click
here for PDF file)
 SCS NS
(click image to view; click
here for PDF file)
SCS NS
(click image to view; click
here for PDF file)
 SCS EW
(click image to view; click
here for PDF file)
SCS EW
(click image to view; click
here for PDF file)
 DHL NS
(click image to view; click
here for PDF file)
DHL NS
(click image to view; click
here for PDF file)
 DHL EW
(click image to view; click
here for PDF file)
DHL EW
(click image to view; click
here for PDF file)
 PFO NS
(click image to view; click
here for PDF file)
PFO NS
(click image to view; click
here for PDF file)
 PFO EW
(click image to view; click
here for PDF file)
PFO EW
(click image to view; click
here for PDF file)
 PFO NW
(click image to view; click
here for PDF file)
PFO NW
(click image to view; click
here for PDF file)
 GVS NS
(click image to view; click
here for PDF file)
GVS NS
(click image to view; click
here for PDF file)
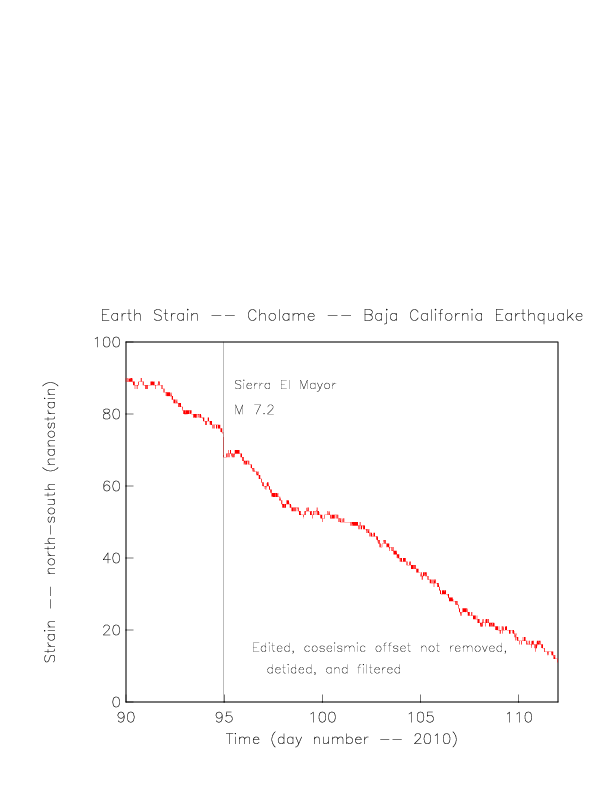 CHL NS
(click image to view; click
here for PDF file)
CHL NS
(click image to view; click
here for PDF file)
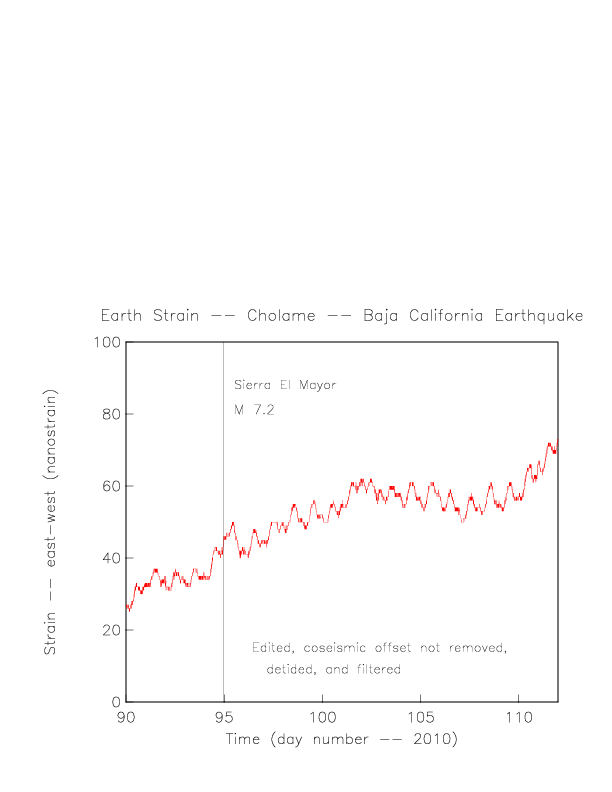 CHL EW
(click image to view; click
here for PDF file)
CHL EW
(click image to view; click
here for PDF file)
Return to main longbase strainmeter page